雅思各类图表写作解题思路汇总
今天,南京雅思培训机构老师给大家带来雅思各类图表写作解题思路汇总,大家可以仔细阅读一下,希望能对大家有所帮助。
01
柱形图
特点:题目提供的信息量大,分类对比复杂。
解题思路:一般按图例分类描写,说明极值和趋势,描述对比结果。
题目:
You should spend about 20 minutes on this task.
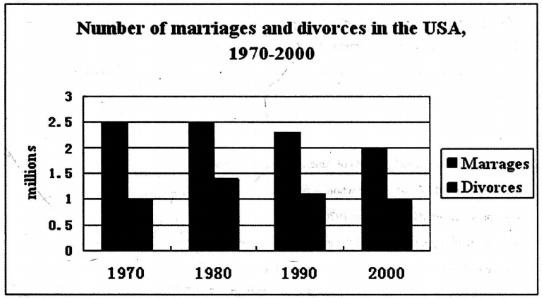
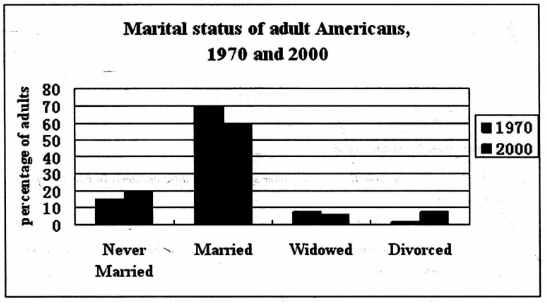
The charts below give information about USA marriage and divorce rates between 1970 and 2000,and the marital status ofadult Americans in two ofthe years.
Summarise the information by selecting and reporting the main features, and make comparisons where relevant.
Write at least 150 words
02
表格
特点:数字较多,规律不明显。
解题思路:需要从纵向和横向双向对比总结,描述最 大值和最 小值。中间数字可粗略交代。描述对比结果。
题目:
You should spend about 20 minutes on this task.
The table below gives in formation on consumer spending on different items in five different countries in 2002.
Summarise the information by selecting and reporting the main features, and make comparisons where relevant.
Write at least 150 words.
Percentage ofnational consumer expenditure by category-2002
Country | Food/Drink/Tobacco | Clothing/Footwear | Leisure/Education |
Ireland | 28.91% | 6.43% | 2.21% |
Italy | 16.36% | 9.00% | 3.20% |
Spain | 18.80% | 6.51% | 1.98% |
Sweden | 15.77% | 5.40% | 3.22% |
Turkey | 32.14% | 6.63% | 4.35% |
03
饼图、线形图
饼图
特点:图形本身信息量少,多以多个饼图或混合图表的题目出现。
解题思路:分类描述百分比,说明极值,描述对比结果。
线性图
特点:单曲线和多曲线,趋势明显。
解题思路:各曲线起点、终点、拐点数值,变化趋势。两曲线交点说明。描述对比结果。
题目:
You should spend about 20 minutes on this task.
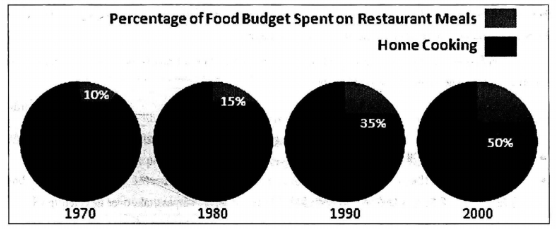
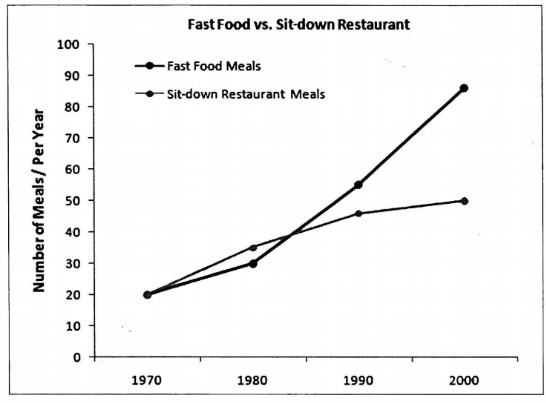
The charts below show the percentage oftheir food budget the average family spent on restaurant meals in different years. The graph shows the number ofmeals eaten in fast food restaurants and sit-down restaurants.
You should write at least 150 words
以上就是南京雅思培训机构老师分享的雅思各类图表写作解题思路汇总的全部内容,更过有关雅思考试的问题,可以咨询新航道在线老师。


