雅思小作文柱状图的高分关键写法(考点+范文)一应俱全!
雅思小作文柱状图的高分关键写法(考点+范文)一应俱全!在雅思小作文数据类题目中,柱状图的信息量往往较多且杂,因而成为了了大部分雅思烤鸭们比较头疼的题型。

这样的一个柱图很多同学都是卡在6分,主要原因是很多同学只写了各个柱子的升降变化,图形中的对比没有写到位。只要在原有升降变化的时候把足够的对比加进去,分数立即得到提高!
哪些位置是对比的关键呢?南京雅思培训机构老师带大家一起逐一来看。
第一点
写最值,也就是图形里最大、最小数据或者变化最激烈的项目。
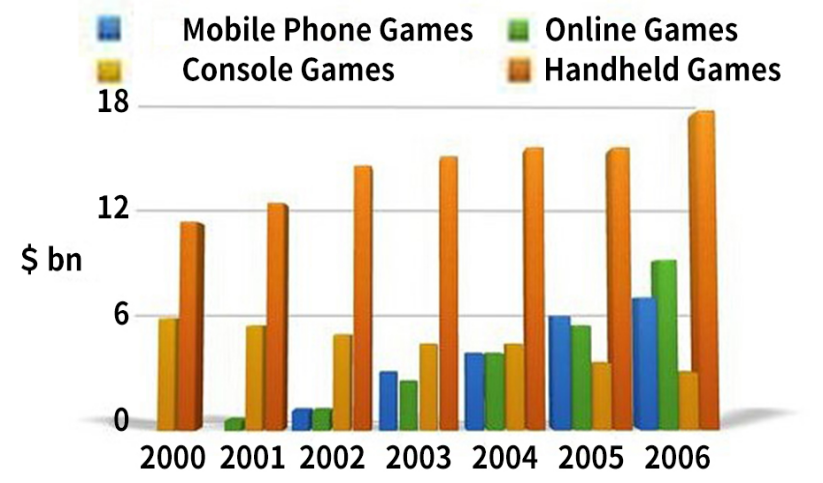
As shown in the chart, throughout the period, handheld games were invariably the bestsellers.
第二点
看到图形中有两个东西放在一起,往往会产生对比。
In year of 2000, a total of 11 billion dollars’ worth of handheld games were sold, whereas the sales of console games were approximately half of that amount.
第三点
一个项目的动态变化,开头是结尾的一半或者结尾是开头的一半要引起注意,往往是拿分点。
By 2006, its sales figure had been reduced to a measly 3 billion dollars, only half of what it was in 2000.
第四点
两个交缠在一起变化的东西,比如线图里的两线相交,柱图里的一根柱子高于另一根,都会进行对比,写A数据超过B数据。这样既有对比的TA得分,又有单词得分。
Ever since their debut, their roaring popularity was reflected in the sales over the first several years and soon overtaking/outnumbering those of console games.
第五点
两个项目变化相似,最后两者之间相差不大。如果只写相差不大,词句得分和对比的TA得分都不好。往往会写对比句子,称之为紧随其后。
By 2006, the online-gaming sector had the second-biggest sales figure, bringing in a total of 9 billion dollars; the mobile-game sector did not lag far behind, earning well over 6 billion dollars in that year.
第六点
一个图形如果发现是同类项目的变化,而且大多数都是明显上升只有少数轻微下降,在写综述的时候不能只总结升降,要同时总结总数变多的总体对比来拿到更好的TA分数。
Overall, except for the decreasing sales of console games, sales of games for three out of the four platforms rose each year, leading to a significant rise in total global turnover over the 7-year period.
参考范文:
The chart compares the annual revenue of four sectors of the video game market over the course of 7 years.
Overall, except for the decreasing sales of console games, sales of games for three out of the four platforms rose each year, leading to a significant rise in total global turnover over the 7-year period.
As shown in the chart, throughout the period, handheld games were invariably the bestsellers; in almost any given year, this sector seemed to earn at a range of at least two to ten times higher than any other sectors. Back in the year 2000, there were only two types of video games on the market: console games and handheld games. In that year, a total of 11 billion dollars’ worth of handheld games were sold, whereas the sales of console games were approximately half of that amount. The next six years saw the handheld-game market gaining more momentum, with its earnings reaching a whopping 18-billion-dollar high in 2006.
The console game market, however, did not respond very well, increasingly losing ground to the other sectors. By 2006, its sales figure had been reduced to a measly 3 billion dollars, only half of what it was in 2000.
From the chart, we can also see two more new players in the gaming industry: online and mobile-phone games, which did not hit the market until 2001 and 2002, respectively. Ever since their debut, their roaring popularity was reflected in the sales over the first several years and soon overtaking those of console games. By 2006, the online-gaming sector had the second-biggest sales figure, bringing in a total of 9 billion dollars; the mobile-game sector did not lag far behind, earning well over 6 billion dollars in that year.
通过以上的例题,我们不难看出,在雅思作文柱状图中,柱子间差距的大小和变化总是会成为一个隐藏的重要信息点。
以上就是新航道南京雅思培训机构老师分享的雅思小作文柱状图的高分关键写法(考点+范文)一应俱全的全部内容,如果烤鸭们能有意识去发现差距所代表的信息点,那么柱状图的高分就不难斩获了。


