雅思写作柱状图类范文和解析
雅思写作中柱状图类题目如何写作?南京新航道学校雅思频道为烤鸭们搜集了以下柱状图写作范文和解析,大家可以学习借鉴。特别提醒:范文学习的是别人的写作方法,而不是直接背诵李文,照搬至写作中。
雅思柱状图范文一:
You should spend about 20 minutes on the task.
The bar chart below shows the number of male and female students studying at secondary and higher levels of education across Europe, Sub-Saharan Africa, Latin America and East Asia.
Write a report for a university lecturer comparing and contrasting the information from the two charts below.
You should write at least 150 words.

The graphs illustrate the percentage of males and females studying at secondary and higher levels of education in Europe, Sub-Saharan Africa, Latin America and East Asia. As can be seen from the graph, the overall trends generally suggest that more male and female students attend secondary education than higher education across these parts of the world, with females proving to be slightly higher than males.
Firstly, in regards to Europe, males and females studying at a secondary education level peaked at nearly 100% but declined to just under half that amount for higher education. However, in Sub-Saharan Africa secondary education was much lower with females reaching only 19% and males 10%.
A similar low level of higher education exists for Sub-Saharan students with females falling to 16% and males sharply rising to 18%.
Latin America and East Asia both show a similar decline from secondary to higher education with Latin American males and female’s numbers falling from 47% to 27%, and 39% to 22% respectively, and East Asian males and female’s numbers dropping from 39% to 21% and 50% to 21% respectively.
In conclusion, apart from male students in Sub-Saharan Africa, generally higher education seems noticeably less popular for male and female students in these parts of the world.
雅思柱状图范文二:
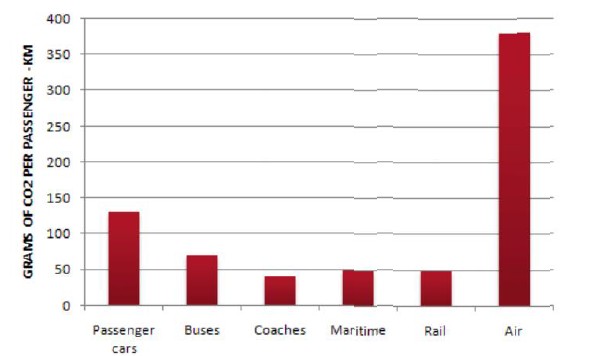
The table below shows CO2 emissions for different forms of transport in the European Union.
The pie chart shows the percentage of European Union funds being spent on different forms of transport.

model answer:
The chart shows CO2 emissions per passenger kilometre for various methods of transport in the European Union while the pie chart shows European Union spending on transport. Flying by air produces by far the greatest CO2 emissions, approximately three times as much as passenger cars which are the next largest producers. Very little is spent by the EU on air travel while roads make up more than half of the EU transport budget.
Trains produce about three times less CO2 emissions per passenger kilometre than passenger cars and eight times less than air travel. Nearly a third of EU transport funds are spent on railways.
Ships are a clean form of transport and produce about the same amount of CO2 per passenger kilometres as trains do. However, only 2 percent of EU funds are spent on ports. A further one percent is spent on inland waterways.
Coaches are the cleanest form of transport. Emissions of CO2 per passenger kilometre from coaches are half those of buses. Buses emit less than half as much CO2 per passenger kilometre as cars. The European Union spends 10 percent of its transport budget on public transport, such as buses and coaches.
南京新航道学校提供专业的雅思培训、托福培训、GRE培训、SAT培训、剑桥青少英语培训等,帮助广大学子“用英语点亮人生”。
新航道致力于帮助学生提高英语能力,决胜雅思、托福、SAT、GRE等出国考试,分享励志成长、英语学习、考试信息、留学动态,尊重英语学习!南京新航道官网微信号:xhd-nanjing.
新朋友关注方法:
1、添加微信号:xhd-nanjing
2、二维码关注:保存图片——打开微信扫一扫——从相册选择二维码(适用手机端)