剑桥雅思5test1写作小作文范文+解析
本片新航道雅思给大家先带来:剑桥雅思5test1写作小作文范文+解析;下一篇文章我们将分享test1的大作文。
剑桥雅思5test1写作小作文题目:
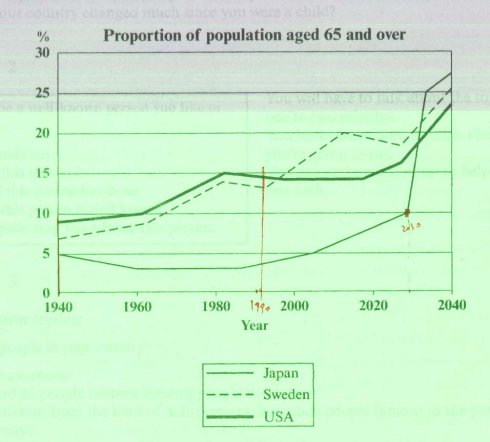
The graph below shows the proportion of the population aged 65 and over between 1940 and 2040 in three different countries.
Summarize the information by selecting and reporting the main features, and make comparisons where relevant.

雅思写作小作文范文
The graph shows the increase in the ageing population in Japan, Sweden and the USA. It indicates that the percentage of elderly people in all three countries in expected to increase to almost 25% of the respective populations by the year 2040.
In 1940 the proportion of people aged 65 or more stood at only 5% in Japan, approximately 7% in Sweden and 9% in the US. However, while the figures for the Western countries grew to about 15% in around 1990, the figure for Japan dipped to only 2.5% for much of this period, before rising to almost 5% again at the present time.
In spite of some fluctuation in the expected percentages, the proportion of older people will probably continue to increase in the next two decades in the three countries. A more dramatic rise is predicted between 2030 and 2040 in Japan, by which time it is thought that the proportion of elderly people will be similar in the three countries.
这是一个典型的线图,线图一般是依据时间轴来描述某个状况在一定时间内的变化趋势,所以在审题上很难出现偏差,但是线图的难点在于线条变化曲折,如果完全描述,不但过于琐碎,而且意义不大,所以线条的变化情况需要取舍,这是线图的难点。
步:确定X轴和Y轴
X1 有序变量 年代 1940-2040,准确的说,线图当中的时间轴变量属于有序变量中的连续变量,
X2 无序变量 国家(日本、瑞典、美国)
Y 变量 老人所占该国总人群比例
第二步:分析图表
看到X1年代时间轴时,我们应当特别注意到时间是1940-2040,也就是本图表包括了过去时间和将来时间,其过去时间和将来时间的分界点就在于2000-2020这个区间,所以分析时必须将跨越临界点的变化趋势分析出来,写作时肯定用到。注意到这个特殊点之后,就开始进行常规的X, Y轴分析
X2为Japan时,Y轴变化情形
起点是5%,终点是35%,涨幅是30%。
跨越时间临界点的变化时继续上涨
变化趋势,从起点1940-过了2000年,呈一个先下降后升高的趋势,两段终点为均为5%;之后缓慢升高,2030年达到10%;2030-2040年猛增,终点是35%。
X2为Sweden时,Y轴变化情形
起点是7%,终点是25%多一点,涨幅是18%
跨越时间临界点的变化是上涨,但是之后有个小的下降
变化趋势,持续上涨,整个过程只有1980-1990和2010-2030这两个区段稍微下降
X2为USA时,Y轴的变化情况
起点为9%,终点是23%,涨幅为14%。
跨越时间临界点的变化为持平然后上涨
变化趋势,持续上涨,只是1940-1965和1982-2020为持平状态
X1为1940时,日本5%,瑞典7%,美国9%
X1为1940到临界点时,瑞典和美国上升,均达到15%左右;而日本先稍微下降而后上升,1940和临界点的结果持平,5%
X1为临界点到终点2040,瑞典和美国继续上升,最后终点是25%左右;而日本继续上升,特别是2030后猛升,最后超越瑞典和美国,终点值35%
第三步:确定框架
有X1,X2同时存在时,就应当有2个文章发展框架,如此处可以按照X2为主框架,X1为从框架来进行描述,如本例X2(瑞典、日本、美国),即描述瑞典的变化趋势,再描述美国的,最后描述日本的。
同样可以X1为主框架,即描述三国起点的状况,再是起点到临界点的状况,最后是临界点到终点的状况,范文采用的就是这样的描述方式。
两种逻辑框架均可以,只是要特别注意,分析部分的重要信息应当不能有遗漏,从框架的信息必须安排好。
题目
The graph below shows the proportion of the population aged 65 and over between 1940 and 2040 in three different countries.
段
The graph shows the increase in the ageing population in Japan, Sweden and the USA.
作者没有一上来提示图表内容,而是直接奔向中心思想,也就是文章的主旨句。
increase in sth 注意名词increase后面常用到的介词in
It indicates that the percentage of elderly people in all three countries is expected to increase to almost 25% of the respective populations by the year 2040.
对文章中心句的进一步解释说明,即具体说明increase
句子主干为 The percentage is expected to increase to sth, be expected to do表示对未来的一种预测,increase to 25%中的to为prep
第二段
In 1940 the proportion of people aged 65 or more stood at only 5% in Japan, approximately 7% in Sweden and 9% in the US.
说明起点,主干为the proportion stood at , stand at+数值,相当于is+数值
people aged 65 or more,其中aged 65 or more为后置定语,aged [adj], 如a man aged between 25 and 35
However, while the figures for the Western countries grew to about 15% in around 1990, the figure for Japan dipped to only 2.5% for much of this period, before rising to almost 5% again at the present time.
说明了从起点到临界点之前三个地区的数据变化情况,
表示数据变化的表达是 the figures grow to, the figures dip to, the figure rise to这样三个句子,通过while [conj], 将西方国家和日本对照来说,接着通过before [prep]将日本的两段变化情形描述出来,
表示时间的部分 in around 1990, for much of this period, at the present time
第三段
In spite of some fluctuation in the expected percentages, the proportion of older people will probably continue to increase in the next two decades in the three countries.
总体说明了临界点后的趋势变化,注意时态为将来时,the proportion will continue to do sth
In spite of some fluctuation 一个简单的让步从句,就把一些不作具体描述的波动一带而过,这点在描述线图当中必须掌握,记住“忽视细微变化”
A more dramatic rise is predicted between 2030 and 2040 in Japan, by which time it is thought that the proportion of elderly people will be similar in the three countries.
这句话其实是两句截然不同的两层意思,层是日本2030到2040上涨幅度巨大,第二层意思是三个国家终点相似,通过一个简单的时间关联 by which time (2040) 把两个简单句连接成一个复杂句,这种技巧尤其是在线图和流程图中体现得特别明显,因为两种都是以时间为发展趋势,涉及到很多琐碎的变化,通过时间关联成分,如by which time, until, during the same period,when使句型复杂化,这点需要不断学习掌握。
be predicted/ be supposed/ be expected 这些常用来表示推测的将来趋势
词汇句型积累
线图主要描述随着时间的某种的变化,所以其核心的两个表达内容就是时间表达和变化表达
时间表达
By the year 2040, in 1940, in around 1990, for much of this period, at the present time, in the next two decades, between 2030 and 2040, by which time
变化表达
The increase in sth, be expected to increase to sth, The figure stood at sth, grow to sth, dip to sth, rise to sth, a more dramatic rise


