剑桥雅思6test4小作文范文
剑桥雅思6test4小作文范文
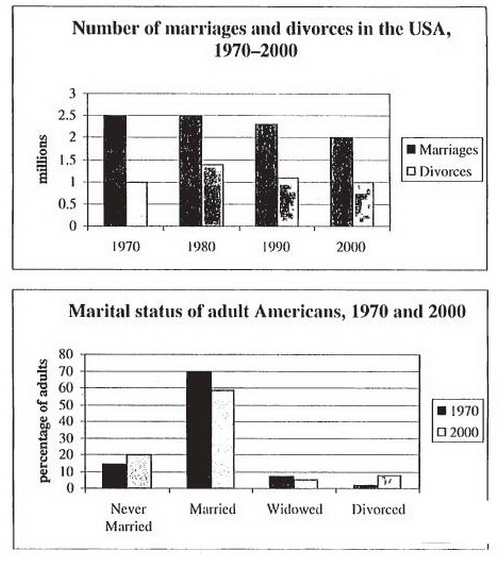
题目:The charts below give information about USA marriage and divorce rates between 1970 and 2000, and the marital status of adult Americans in two of the years.

雅思写作范文:
The first chart depicts how the number of married and divoced peoeple changed in sketch between 1970 and 2000. The number of married adults ran high at 2.5 million and remained the same till 1980, when it started to go down to 2.0 million eventually in 2000. By contrast, though substantially lower than those in marriage, people suffering a broken marriage generally stayed a stable level of 1.0 million except a sharp rise to approximately 1.5 million in 1980 during this entire period.
According with the result revealed in the first chart, the status of being married (60-70%) was still a mainstream accepted by adults against other marital statusesnever married, divorced and widowed. Those were generally lower than 20% or 10%. Interestingly, while the second chart tells a corresponding trend of decline from 70% to 60%, when we view the figure of the married in proportion, the change of divorced people contradicted what is indicated in the first chart, increasing drastically from nearly 3% to 9%.
Overall, the statistic results may vary vastly if it is viewed from different angles.


